Top command in linux and filter every rows using awk and explanation
Top
command is one of the most powerful command to monitor the cpu and memory usage
on linux system as well as give the details information of the processes which
is listed with PID,user,cpu and memory utilization by the process ,total time
taken by the process and so on.
We
also know current system time,total up time of the system,no of concurrent
users and the cpu load using the top command.So,top command is the most useful
and powerful command to troubleshot for the system administrator.
When
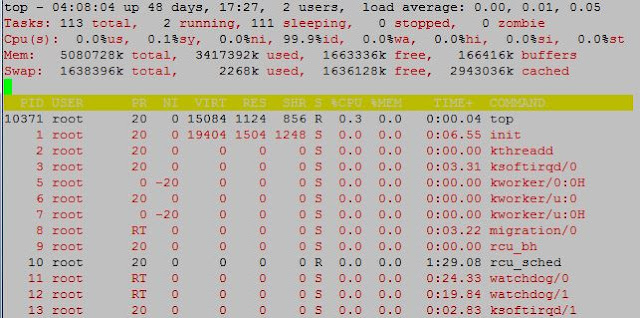
we execute "top" command on the shell we get the following output.
 |
| Top command in linux and filter every rows using awk and explanation |
Explain first row of Top command
# top -bn1
| awk "NR==1" | awk '{print $0}'
top -
04:12:41 up 48 days, 17:32, 2
users, load average: 0.00, 0.01, 0.05
First row gives the
following information.
·
Current
system time (here it is 4:12:41)
·
Up
time of system (here it is 48 days, 17:32)
·
No
of users login the current session(here it is 2 users)
·
Load
average of the system (here it is 0.00, 0.01, 0.05) which indicated last
minutes ,last 5 minutes and last 15 minutes.
Explain second row of Top command
#top -bn1 |
awk "NR==2" | awk '{print $0}'
Tasks: 115
total, 1 running, 114 sleeping, 0 stopped,
0 zombie
Second row gives the following
information.
- No of total processes (here it is 115)
- No of running process(here it is 1)
- No of sleeping process (here it is 114)
- No of stop process( here it is 0)
- No of zombie process(here it is 0)
Zombie process: child
process is killed before the parent process.
Explain third row of Top command
#top -bn1 |
awk "NR==3" | awk '{print $0}'
Cpu(s): 0.1%us,
0.0%sy, 0.0%ni, 99.7%id, 0.2%wa,
0.0%hi, 0.0%si, 0.0%st
Third row gives the
following information.
- Cpu percentage for the user process (here it is 0.1%)
- Cpu percentage for the system process(here it is 0.0%)
- Cpu percentage for the priority process(here it is 0.0%)
- Cpu percentage for the idle process(here it is 99.7%)
- Cpu percentage for the i/o waiting process(here it is 0.2%)
- Cpu percentage for the hardware interrupt(here it is 0.0%)
- Cpu percentage for the software interrupt(here it is 0.0%)
- Cpu percentage for the steal process(here it is 0.0%)
Explain forth row of Top command
#top -bn1 |
awk "NR==4" | awk '{print $0}'
Mem: 5080728k total, 3417472k used, 1663256k free, 166416k buffers
Forth row gives the
following information.
- Total available physical memory(here it is 5080728k)
- Memory in use(here it is 3417472k)
- Free memory (here it is 1663256k)
- Memory in buffer(here it is 166416k)
Explain fifth row of Top command
# top -bn1
| awk "NR==5" | awk '{print $0}'
Swap: 1638396k total, 2268k used, 1636128k free, 2943040k cached
Fifth row gives the
following information.
- Total available physical memory(here it is 1638396k)
- Memory in use(here it is 2268k)
- Free memory (here it is 1636128k)
- Memory in buffer(here it is 2943040k)
Explain the process list
# top -bn1
| awk "NR==8" | awk '{print $0}'
1 root
20 0 19404 1504 1248 S 0.0
0.0 0:06.55 init
Process list gives the
following information.
- Process id of the process(here it is 1).
- Process is executed by the user(here it is root).
- Priority value of the process(here it is 20).
- Nice value of the process(here it is 0).
- Virtual memory used by the process(here it is 19404).
- Real memory used by process(here it is 1504).
- Shared memory used by process(here it is 1248).
- State of the process(here process is in sleep state).
- Cpu utilization percentage by the process(here it is 0.0) .
- Memory utilization percentage by the process(here it is 0.0)
- Running time of the process(here it is 0:06:55)
- Command executed to run the process(here it is init).
Some switches for the top command
- To know the version of the top we use “-v” switch.
- To get the colour format we press “z” switch to do this.
- To identify running process from the slepping process we use “c” switch to do this operation.
- To delay the screen refresh we use “-d” switch.
Colclusion
You can get many switch
function of the top command. To know all switches function go to the man page
of the top command using “man top”.


Please Donate To Bitcoin Address: [[address]]
Donation of [[value]] BTC Received. Thank You.
[[error]]

0 comments:
Post a Comment